Matplotlib
Matplotlib的方便之处在于使用Jupyter notebook时能实时画图并显示,这样一来,远程即可看到服务器上的图。Jupyter notebook上使用matplotlib的魔法——需要加上%matplotlib inline
%matplotlib inline

import matplotlib.pyplot as plt
plt.imshow(img)
柱状图 bar
plt.bar(range(len(mean_hist)), mean_hist, width=1.0, linewidth=1)
plt.xlim([0,256])
#设置横坐标的文字说明
plt.xlabel('Grade')
#设置纵坐标的文字说明
plt.ylabel('Frequency')
#设置标题
plt.title('Title')
plt.show()
散点图 plot
plot(X(pos, 1), X(pos, 2), 'k+', 'LineWidth', 2, 'MarkerSize')
k-black
       b     blue          .     point              -     solid
       g     green         o     circle             :     dotted
       r     red           x     x-mark             -.    dashdot
       c     cyan          +     plus               --    dashed
       m     magenta       *     star             (none)  no line
       y     yellow        s     square
       k     black         d     diamond
       w     white         v     triangle (down)
                           ^     triangle (up)
                           <     triangle (left)
                           >     triangle (right)
                           p     pentagram
                           h     hexagram
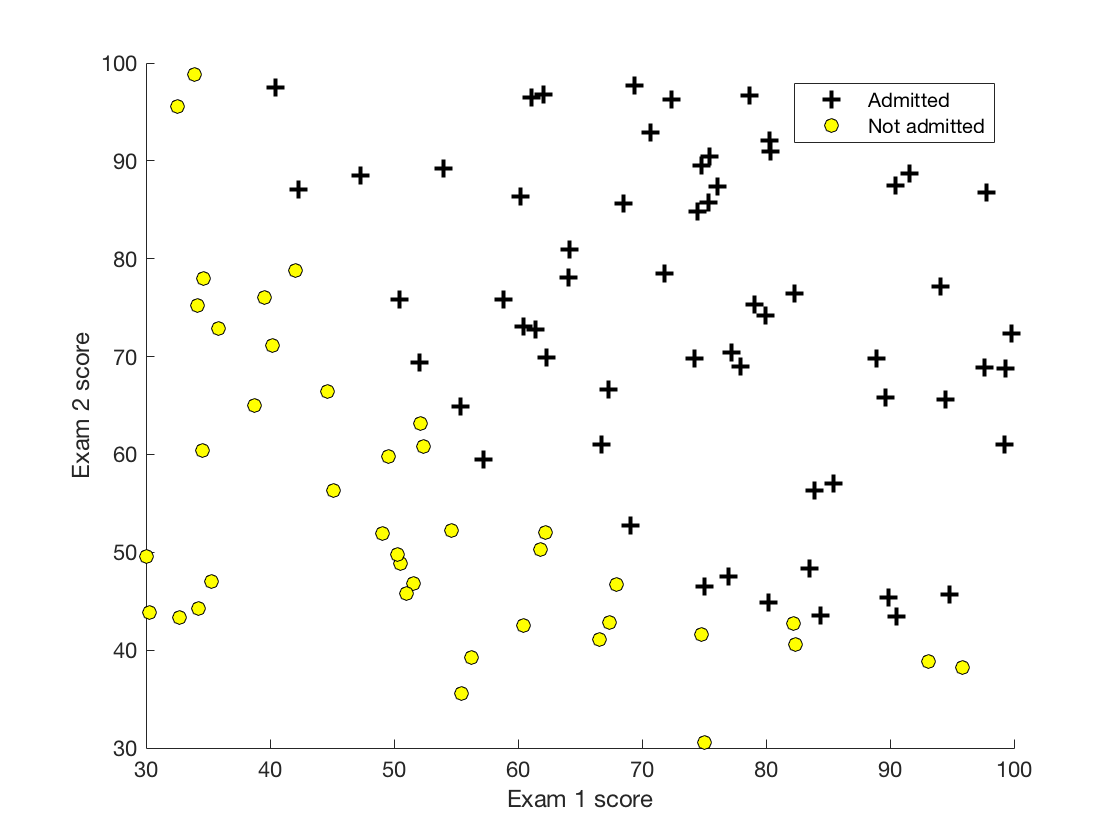
pos = find(y==1);
neg = find(y==0);

plot(X(pos, 1), X(pos, 2), 'k+', 'LineWidth', 2, 'MarkerSize', 7);

plot(X(neg, 1), X(neg, 2), 'ko', 'MarkerFaceColor', 'y', 'MarkerSize', 7);
在图上画框 Rectangle + 画子图
import matplotlib.pyplot as plt
import matplotlib.patches as patches

image = cv2.imread(png_dir + image_name + '.png')
fig1 = plt.figure()
ax1 = fig1.add_subplot(111, aspect='equal')
ax1.imshow(image)
x1,y1,w,h = box
ax1.add_patch(
    patches.Rectangle(
            (x1, y1),   # (x,y)
            w,          # width
            h,          # height
            linewidth=1,edgecolor='r',facecolor='none'
    )
)
plt.text(x1, y1,str(score)[:5], color='w')
plt.imshow(image)
不显示座标轴
plt.axis('off')
保存图片
plt.savefig('example.jpg')